
PISA 2012: How Australia measures up
Research 3 Dec 2013 10 minute readResults from the latest international assessment reveal that, despite still performing above the international average, the mathematics and reading skills of Australian 15-year-olds have slipped backwards over the past decade.
PISA 2012: How Australia measures up
The Australian Council for Educational Research (ACER) released the national report of the 2012 Programme for International Student Assessment (PISA), titled PISA 2012: How Australia measures up, in December 2013.
Managed by ACER at the national and international level for the Organisation for Economic Cooperation and Development (OECD), PISA measures how well 15-year-olds from across the globe are prepared to use their knowledge and skills in mathematics, reading and science to meet real-life challenges.
A combined total of more than half a million students from 65 countries and economies took part in PISA 2012, including a nationally representative sample of around 14 500 Australian students from 775 schools.
International comparisons
Comparing PISA 2012 results internationally, Australia performed equal 17th in mathematics, equal 8th in science and equal 10th in reading, after accounting for insignificant differences between countries and economies.
Table 1: Performance of countries/economies in PISA 2012 in relation to Australia
| Performed at a higher level than Australia | Performed at a similar level to Australia | |
| Mathematical literacy | Shanghai-China, Singapore, Hong Kong-China, Chinese Taipei, Korea, Macao-China, Japan, Liechtenstein, Switzerland, the Netherlands, Estonia, Finland, Canada, Poland, Belgium and Germany | Vietnam, Austria, Ireland, Slovenia, Denmark, New Zealand and the Czech Republic |
| Scientific literacy | Shanghai-China, Hong Kong-China, Singapore, Japan, Finland, Estonia and Korea | Vietnam, Poland, Canada, Liechtenstein, Germany, Chinese Taipei, the Netherlands, Ireland, Macao-China, Switzerland and the United Kingdom |
| Reading literacy | Shanghai-China, Hong Kong-China, Singapore, Japan, Korea, Finland, Ireland, Chinese Taipei and Canada | Poland, Estonia, Liechtenstein, New Zealand, the Netherlands, Belgium, Switzerland, Macao-China, Vietnam, Germany and France |
Trends in achievement
Australia has now participated in all five cycles of PISA since its inception in 2000, allowing trends over time to be mapped.
PISA 2012: How Australia measures up revealed that, while Australian 15-year-old students are still performing above the OECD average, their mathematical and reading literacy achievement declined over the past decade, while their achievement in scientific literacy has remained relatively stable.
Figure 1: Australian achievement in PISA from 2000 to 2012
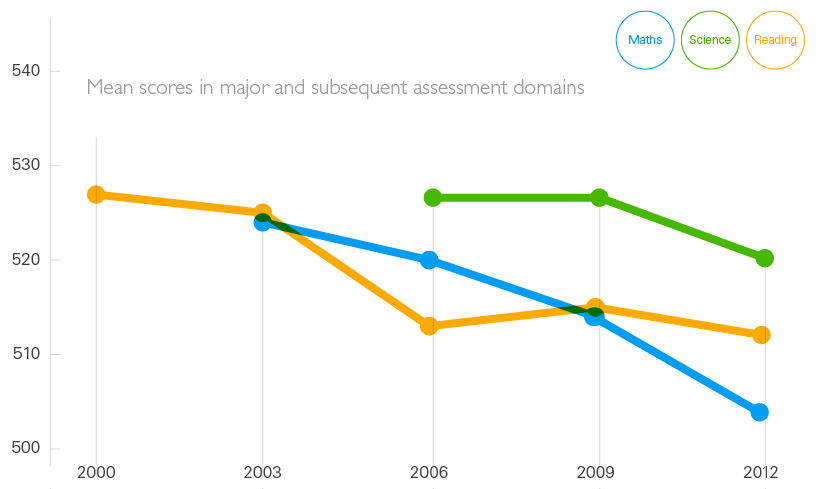
Australia’s mean mathematical literacy performance declined significantly between PISA 2003 and PISA 2012, such that it was the equivalent of students in 2012 being about half a year behind similar students in 2003. Twelve other countries, all OECD members, have also seen a significant decline in their mathematical literacy performance between PISA 2003 and PISA 2012. The largest decline occurred in Sweden, followed by Finland, New Zealand, Iceland then Australia.
The decline in Australia’s reading literacy performance between PISA 2000 and PISA 2012 is also equivalent to around half a year of schooling. Five other countries, again including Sweden, Finland, New Zealand and Iceland, have also seen a significant decline in their reading literacy performance between PISA 2000 and PISA 2012.
While the maths and reading skills of Australian students have been declining or, in the case of science, stagnating, other countries have improved their performance. Nine countries have improved their performance in mathematical literacy, 13 countries have improved in reading literacy and 14 countries in scientific literacy.
Poland has steadily improved since 2000 and is now ahead of Australia in maths, while Ireland has successfully reversed its own downward trend and now outperforms Australia in reading literacy. Since 2009, Poland has managed to improve its mathematical literacy performance by the equivalent of an additional three-quarters of a year of schooling, while Ireland’s improvement in reading literacy represents around four-fifths of a year of additional schooling.
Results within Australia
The PISA 2012 national report attributes Australia’s falling achievement in mathematics and reading literacy to a decline in the proportion of high performing students and an increase in the proportion of low performing students.
Table 2: Percentage of Australian students performing at different proficiency levels
| Mathematical literacy | Scientific literacy | Reading literacy | ||||
| 2003 | 2012 | 2006 | 2012 | 2000 | 2012 | |
| Level 1 or below | 14 | 20 | 13 | 13 | 12 | 14 |
| Level 3 or above | 67 | 59 | 68 | 66 | 69 | 64 |
| Level 5 or above | 21 | 15 | 15 | 14 | 18 | 12 |
Note: PISA Level 3 is identified in Australia’s Measurement Framework for Schooling as the nationally agreed baseline, as it ‘represents a “challenging but reasonable” expectation of student achievement at a year level with students needing to demonstrate more than elementary skills expected at that year level’.
The report also identifies gaps in achievement between Australian students by location, gender and student background.
Location
The average performance of students in the Australian Capital Territory, News South Wales, Queensland and Western Australia was at a higher level than the OECD average in each of mathematical, scientific and reading literacy. South Australia’s students performed above the OECD average in science, but at a similar level to the OECD average in mathematics and reading. Victoria’s students performed above the OECD average in science and reading, but at a similar level to the OECD average in maths. The average performance of students in Tasmania and the Northern Territory was at a similar level to the OECD average in science, but below the OECD average in maths and reading.
The difference between the performance of the highest- and lowest-achieving state or territory in PISA 2012 was the equivalent of almost two years of schooling in mathematical literacy, almost one-and-a-half years of schooling in scientific literacy, and more than one-and-a-half years of schooling in reading literacy.
Location within the states and territories also affected performance in PISA 2012 as, at the national level, students attending metropolitan schools outperformed students in provincial schools, who in turn outperformed students in remote schools. At its most extreme, the difference between the performance of students in metropolitan schools and remote schools was the equivalent of around two years of schooling.
Gender
In Australia and on average across OECD countries, boys outperformed girls in mathematical literacy while girls outperformed boys in reading literacy. The gender difference in achievement was the equivalent of around one-third of a school year for maths and around one year of schooling in reading. In scientific literacy, boys outperformed girls by a narrow margin on average across OECD countries, although in Australia, girls and boys performed at a similar level.
Between PISA 2003 and PISA 2012 Australia’s mathematical literacy performance declined more for girls than it did for boys. While the overall PISA mathematics score for Australia is still higher than the OECD average, the score for girls has dropped so it is equal to the OECD average.
Student background
PISA 2012 found that a difference equivalent to around two-and-a-half years of schooling separates the mathematical, reading and scientific literacy scores of students in the highest socioeconomic quartile and students in the lowest socioeconomic quartile.
Language at home was not found to be a significant factor in mathematical literacy achievement, with the scores of students who spoke English at home similar to those of students who spoke a language other than English at home. For scientific and reading literacy, students who spoke English at home performed at a higher level on average than students who spoke a language other than English at home.
Analysing results in terms of students’ immigrant status, foreign-born students and first-generation students achieved at significantly higher levels than Australian-born students in mathematical literacy. Australian-born students’ performance in scientific and reading literacy was lower than that of first-generation students and was similar to that of foreign-born students.
In terms of Indigenous status, in each of the three assessment domains, non-Indigenous students performed at a higher level on average than Indigenous students, by the equivalent of two-and-a-half years of schooling or more.
Achievement in context
In addition to completing the assessment, students completed a questionnaire to provide information on their family background, aspects of motivation, learning and instruction in mathematics and general context including instructional time and class size. A school questionnaire, answered by the principal or the principal’s delegate, sought descriptive information about the school, including the quality of human and material resources, decision-making processes and information about instructional practices, and school and classroom climate.
Feedback from the questionnaires can help provide explanations for results and raise questions for further examination.
Student attitudes and beliefs
More students across Australia perceived their relationship with teachers to be positive than students across the OECD; however, 25 per cent of Australian students believed that school had done little to prepare them for adult life after school.
The percentage of students reporting that they enjoyed mathematics was highest for the Northern Territory, yet more students from the Northern Territory reported feeling mathematically anxious than students from other states.
Internationally, and in Australia, girls held much more negative beliefs than boys about mathematics. For example:
- Sixty per cent of Australian girls believed they were not good at solving mathematics problems compared to 44 per cent of boys, while 64 per cent of girls believed that sometimes course material is too hard compared to 50 per cent of boys.
- Approximately one-third of Australian girls reported that they did not think that mathematics was important for later study, compared to one-fifth of boys.
- Australian girls were less likely than boys to report feeling capable of successfully completing specific maths problems, and were more likely to attribute failure to external factors or chance and less likely to attribute it to their own efforts.
- Australian girls had higher levels of mathematics anxiety – the worry and tension felt when confronted with mathematical tasks – than boys, with girls reporting levels of anxiety higher than the OECD average, and boys reporting levels lower than the OECD average.
School climate
Class size is often brought up in debates about how to improve achievement. The average class size reported by Australian students was smaller than the OECD average, ranging from an average of 19 students in the Northern Territory to 24 students in New South Wales. Average class sizes for the high-performing countries were 33 students or larger.
Results from PISA 2012 suggest that a school or country’s disciplinary climate is reflected in their achievement. Australian students reported a higher frequency of students not listening, noise and disorder, and teachers having to wait for students to quieten down compared to the OECD average, while high-performing Shanghai-China and Hong Kong-China scored well above the OECD average for disciplinary climate.
Out-of-school factors impacting achievement
Signalling that high academic achievement is not just the responsibility of schools, in high-performing Shanghai-China and Singapore 71 per cent and 68 per cent of students respectively reported attending out-of-school mathematics lessons, compared to only 27 per cent of Australian students.
Delving deeper
The above findings are just a small sample of the information brought to light in Australia’s national report, PISA 2012: How Australia measures up. The next step is for Australia to draw on evidence-based research to find what works in addressing the areas of concern identified by PISA. In the coming months, ACER will produce research briefings focusing in greater detail on specific issues of interest to Australian schools and teachers arising from the latest PISA results.
Read the full report:
PISA 2012: How Australia measures up, by Sue Thomson, Lisa De Bortoli and Sarah Buckley, is available from < https://research.acer.edu.au >